Infographics
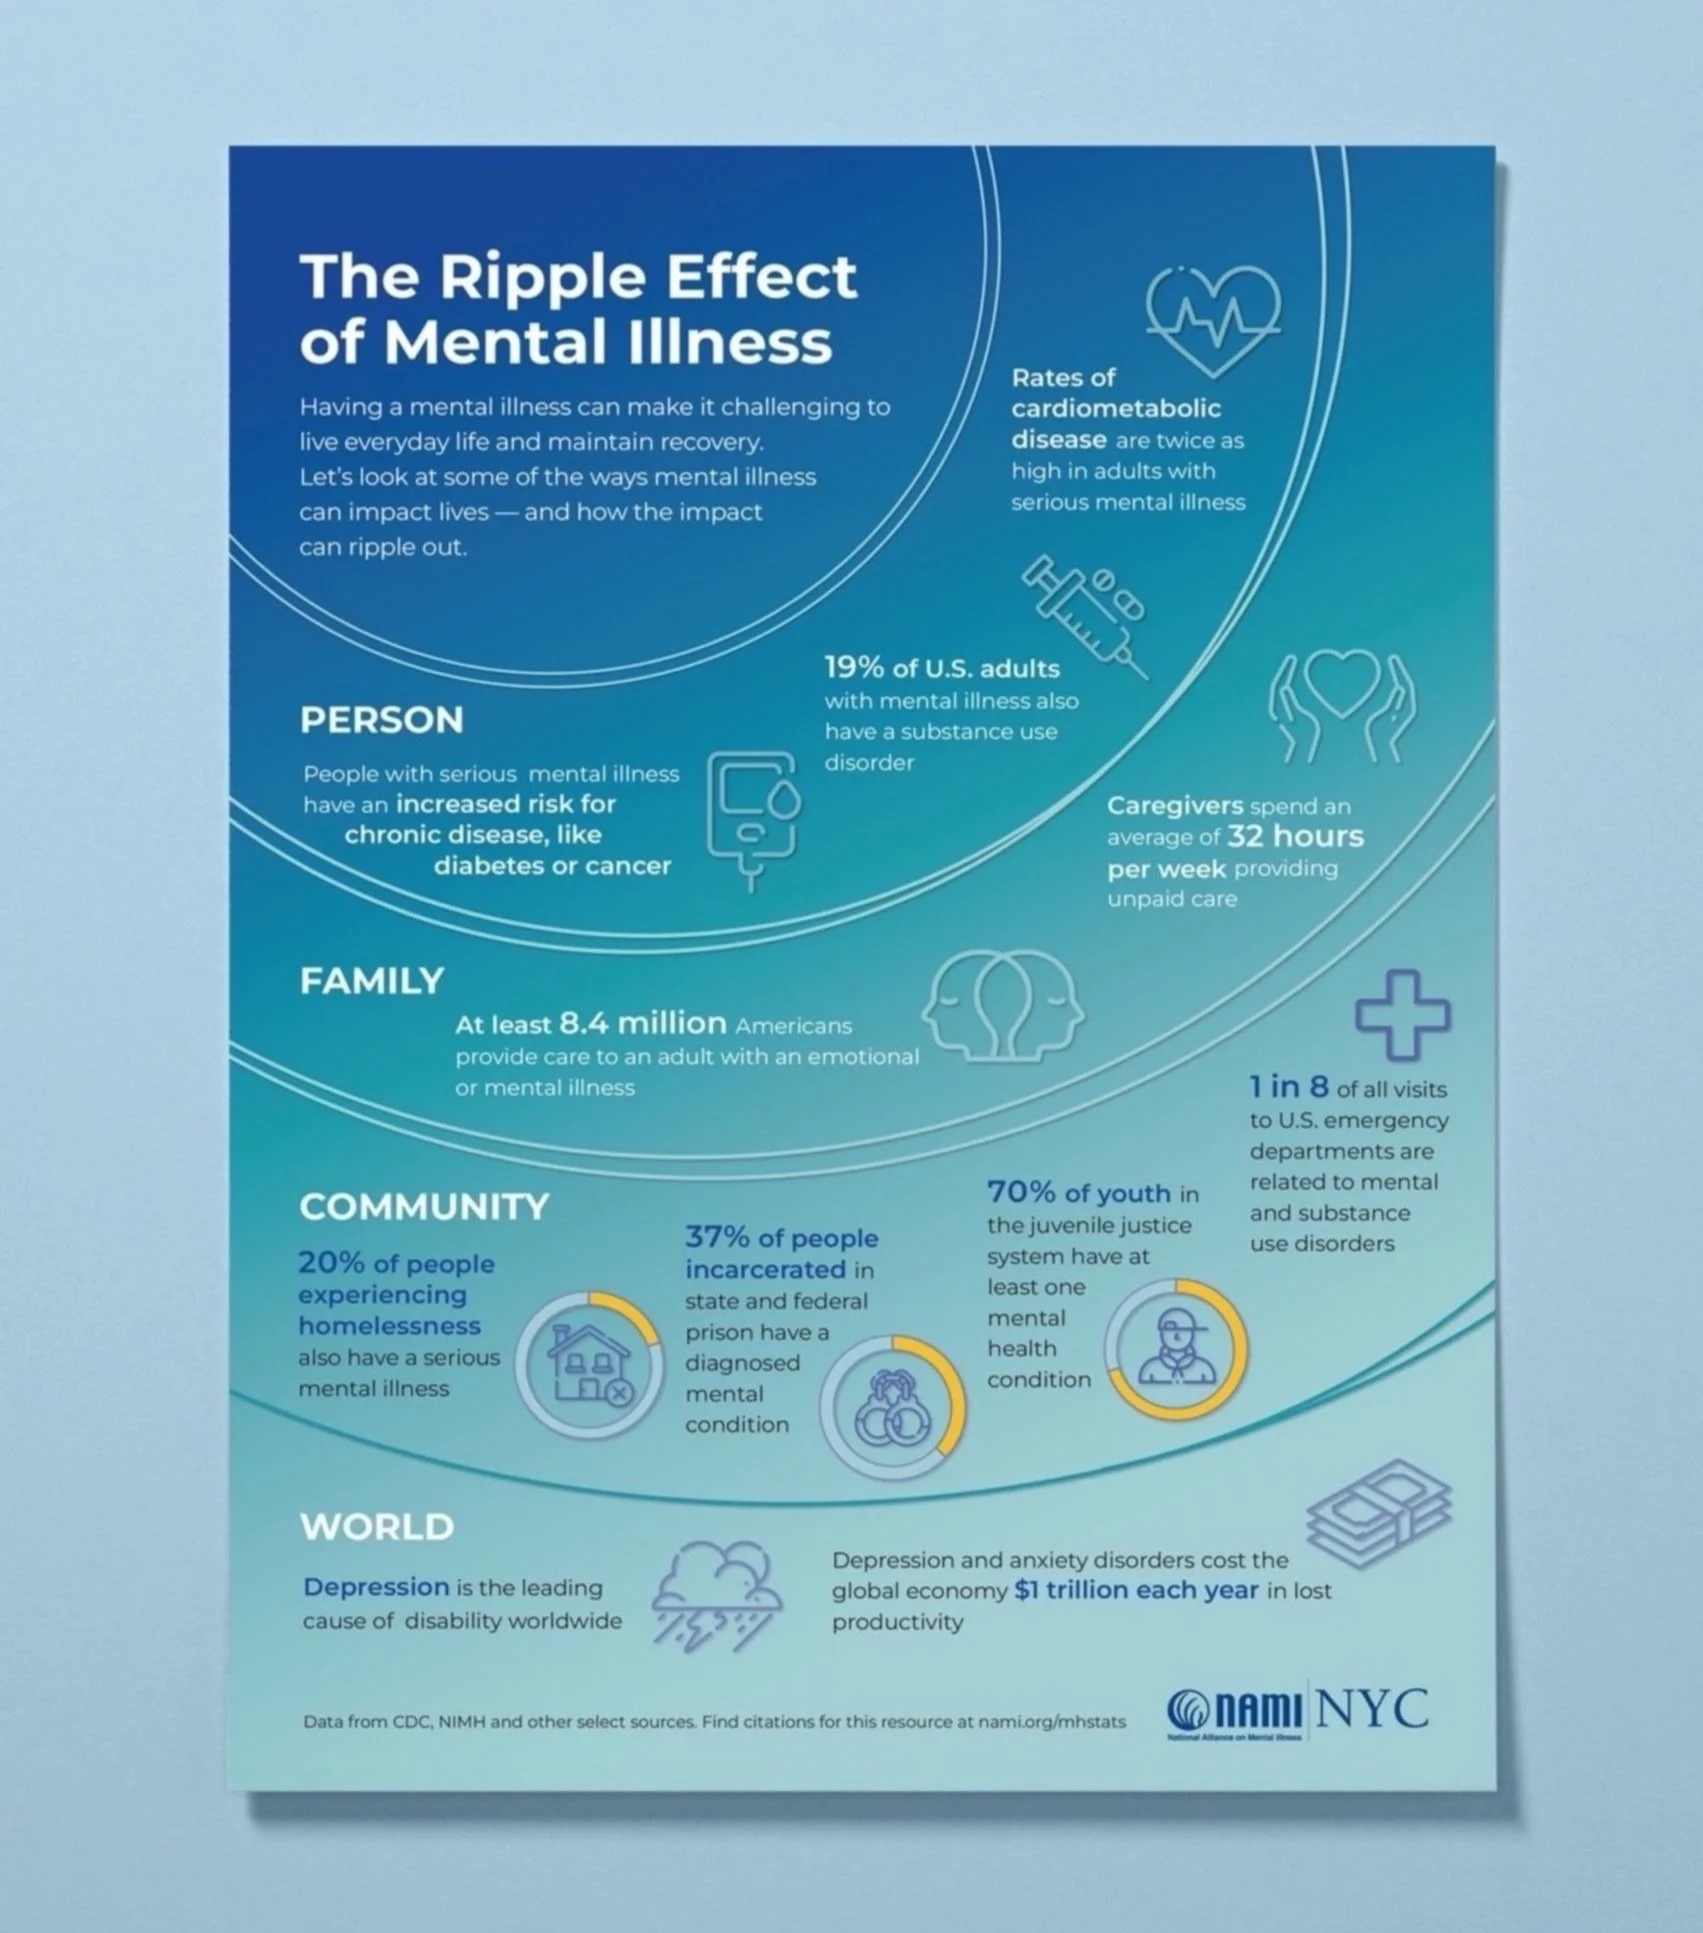
Hard data, made human. For three nonprofits, I turned dense research into infographic posters people stop to read: Facts and Factors: HIV and Diverse Elders for the Diverse Elders Coalition, LGBT Health, Racial Disparities and Aging for SAGE, and The Ripple Effect of Mental Illness for NAMI-NYC. Custom data visualizations tell each story clearly, in print as awareness handouts and online as a series of social posts.
Clients: Diverse Elders Coalition, SAGE, NAMI-NYC · Services: Infographic design, data visualization, social media